Logis-Geotech offers a comprehensive solution for solving problems of localization and mapping of underground utilities. The system includes the СartScan software.
CarScan enables three-dimensional visualisation of GPR files and linking the GPR profile to the terrain map. Information about the detected utilities is displayed on the OpenStreetMap world map.
Processed data can be exported to any GIS system.
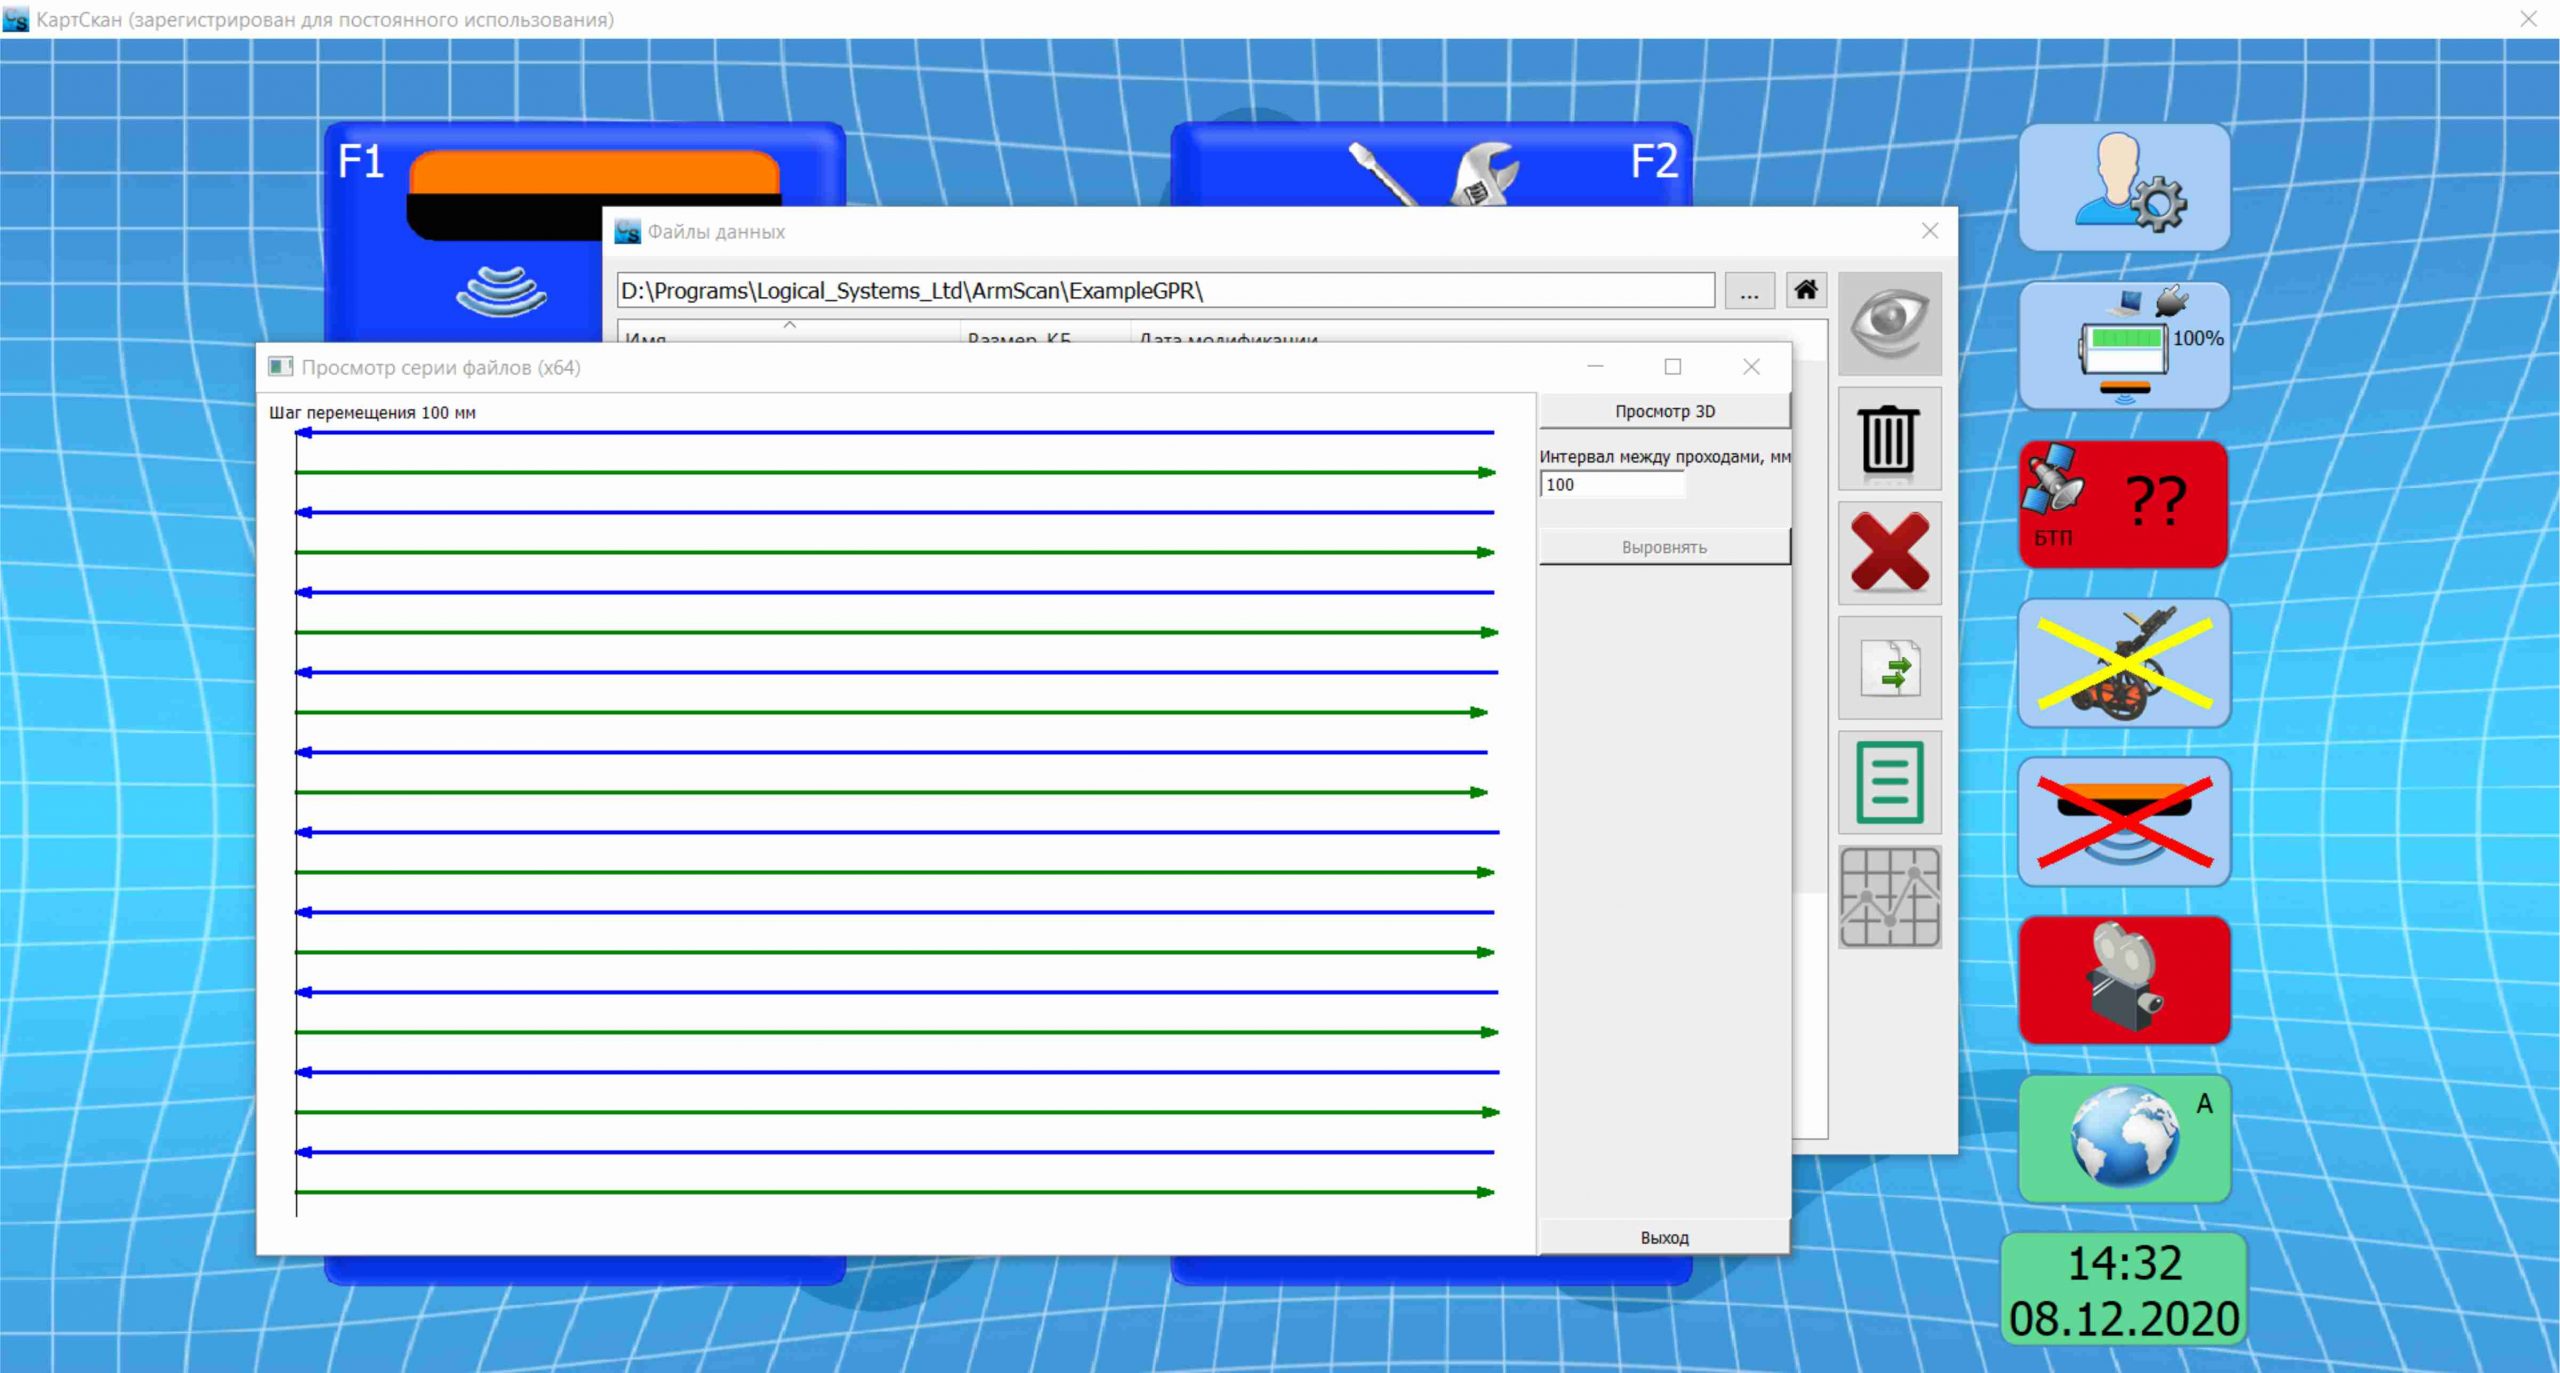
Viewing a series of files.
The series view mode is necessary when scanning a certain area by performing parallel passes with a constant or variable step between them. In this case, each pass is recorded in a separate file, and these files form a series. The mode allows building a three-dimensional picture based on a series of files, after aligning them to control marks with an offset relative to each other.

3D data visualisation.
CartScan represents field or processed data as a series of individual radargrams or as a cube of echo amplitude data. It is possible to view “cross-section” data, change the colour palette, contrast and gain.

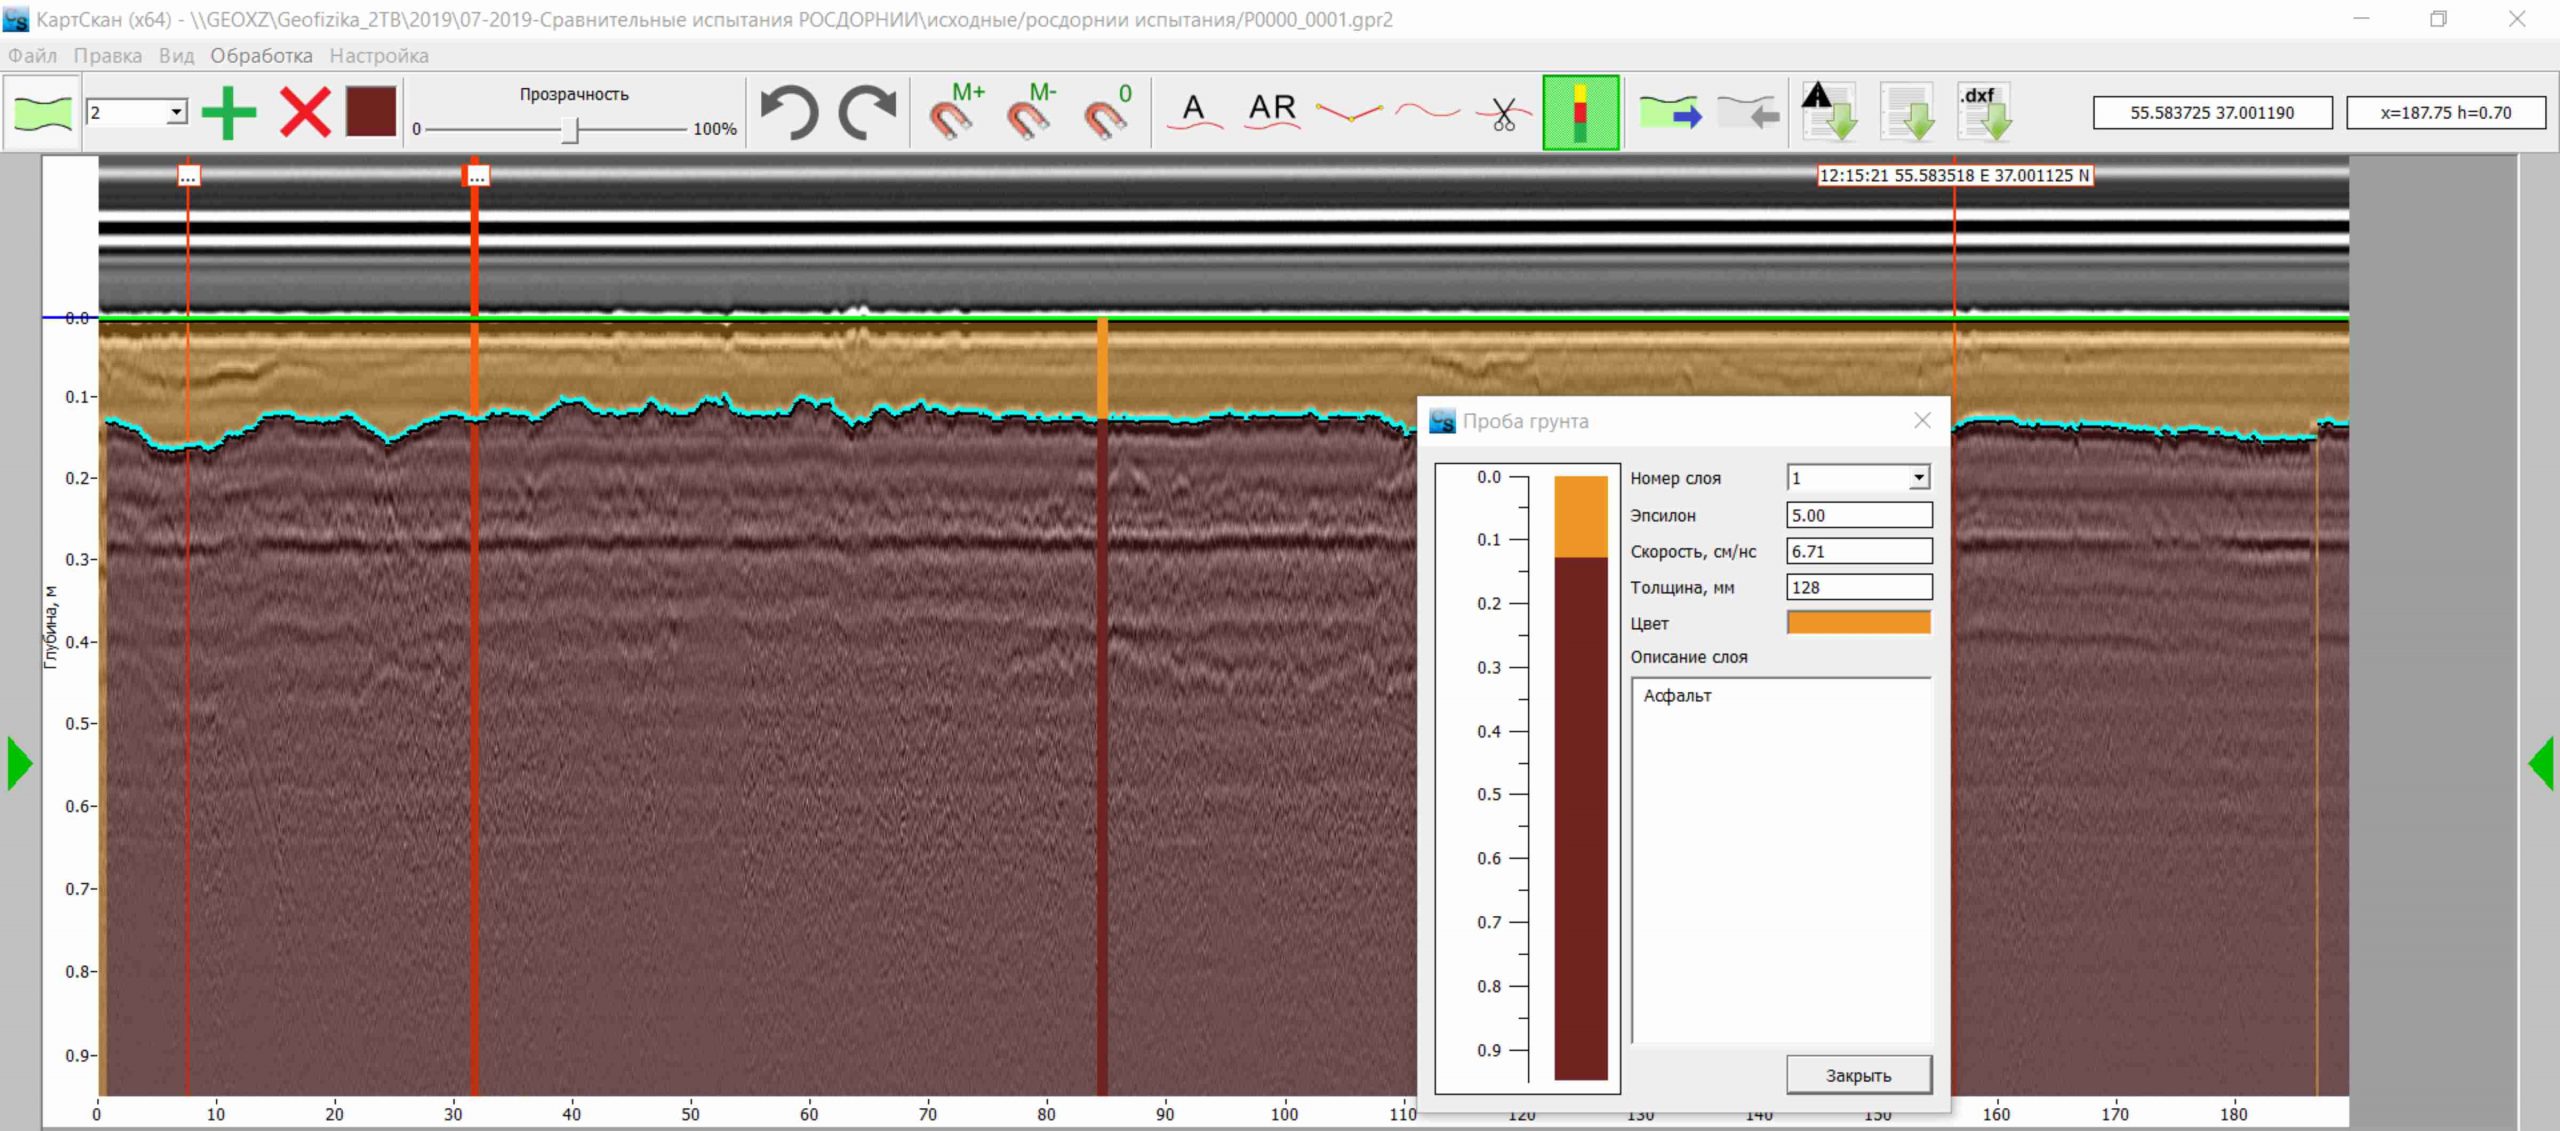
Layer processing mode.
The program also offers an automatic layer boundary tracing mode. It is possible to calculate the dielectric constants of the conducted layers based on the entered drilling data or other parameters known at any point. Export to CAD systems (extension *.dxf), saving the power table and selected layers in *.xls format is available.
Energy analysis. Automatic search for waterlogged zones.
Energy analysis allows users to analyse the radargram according to the criterion of maximum energy. The maximum energy of the reflected signal can indirectly indicate areas with high moisture content, waterlogged areas.
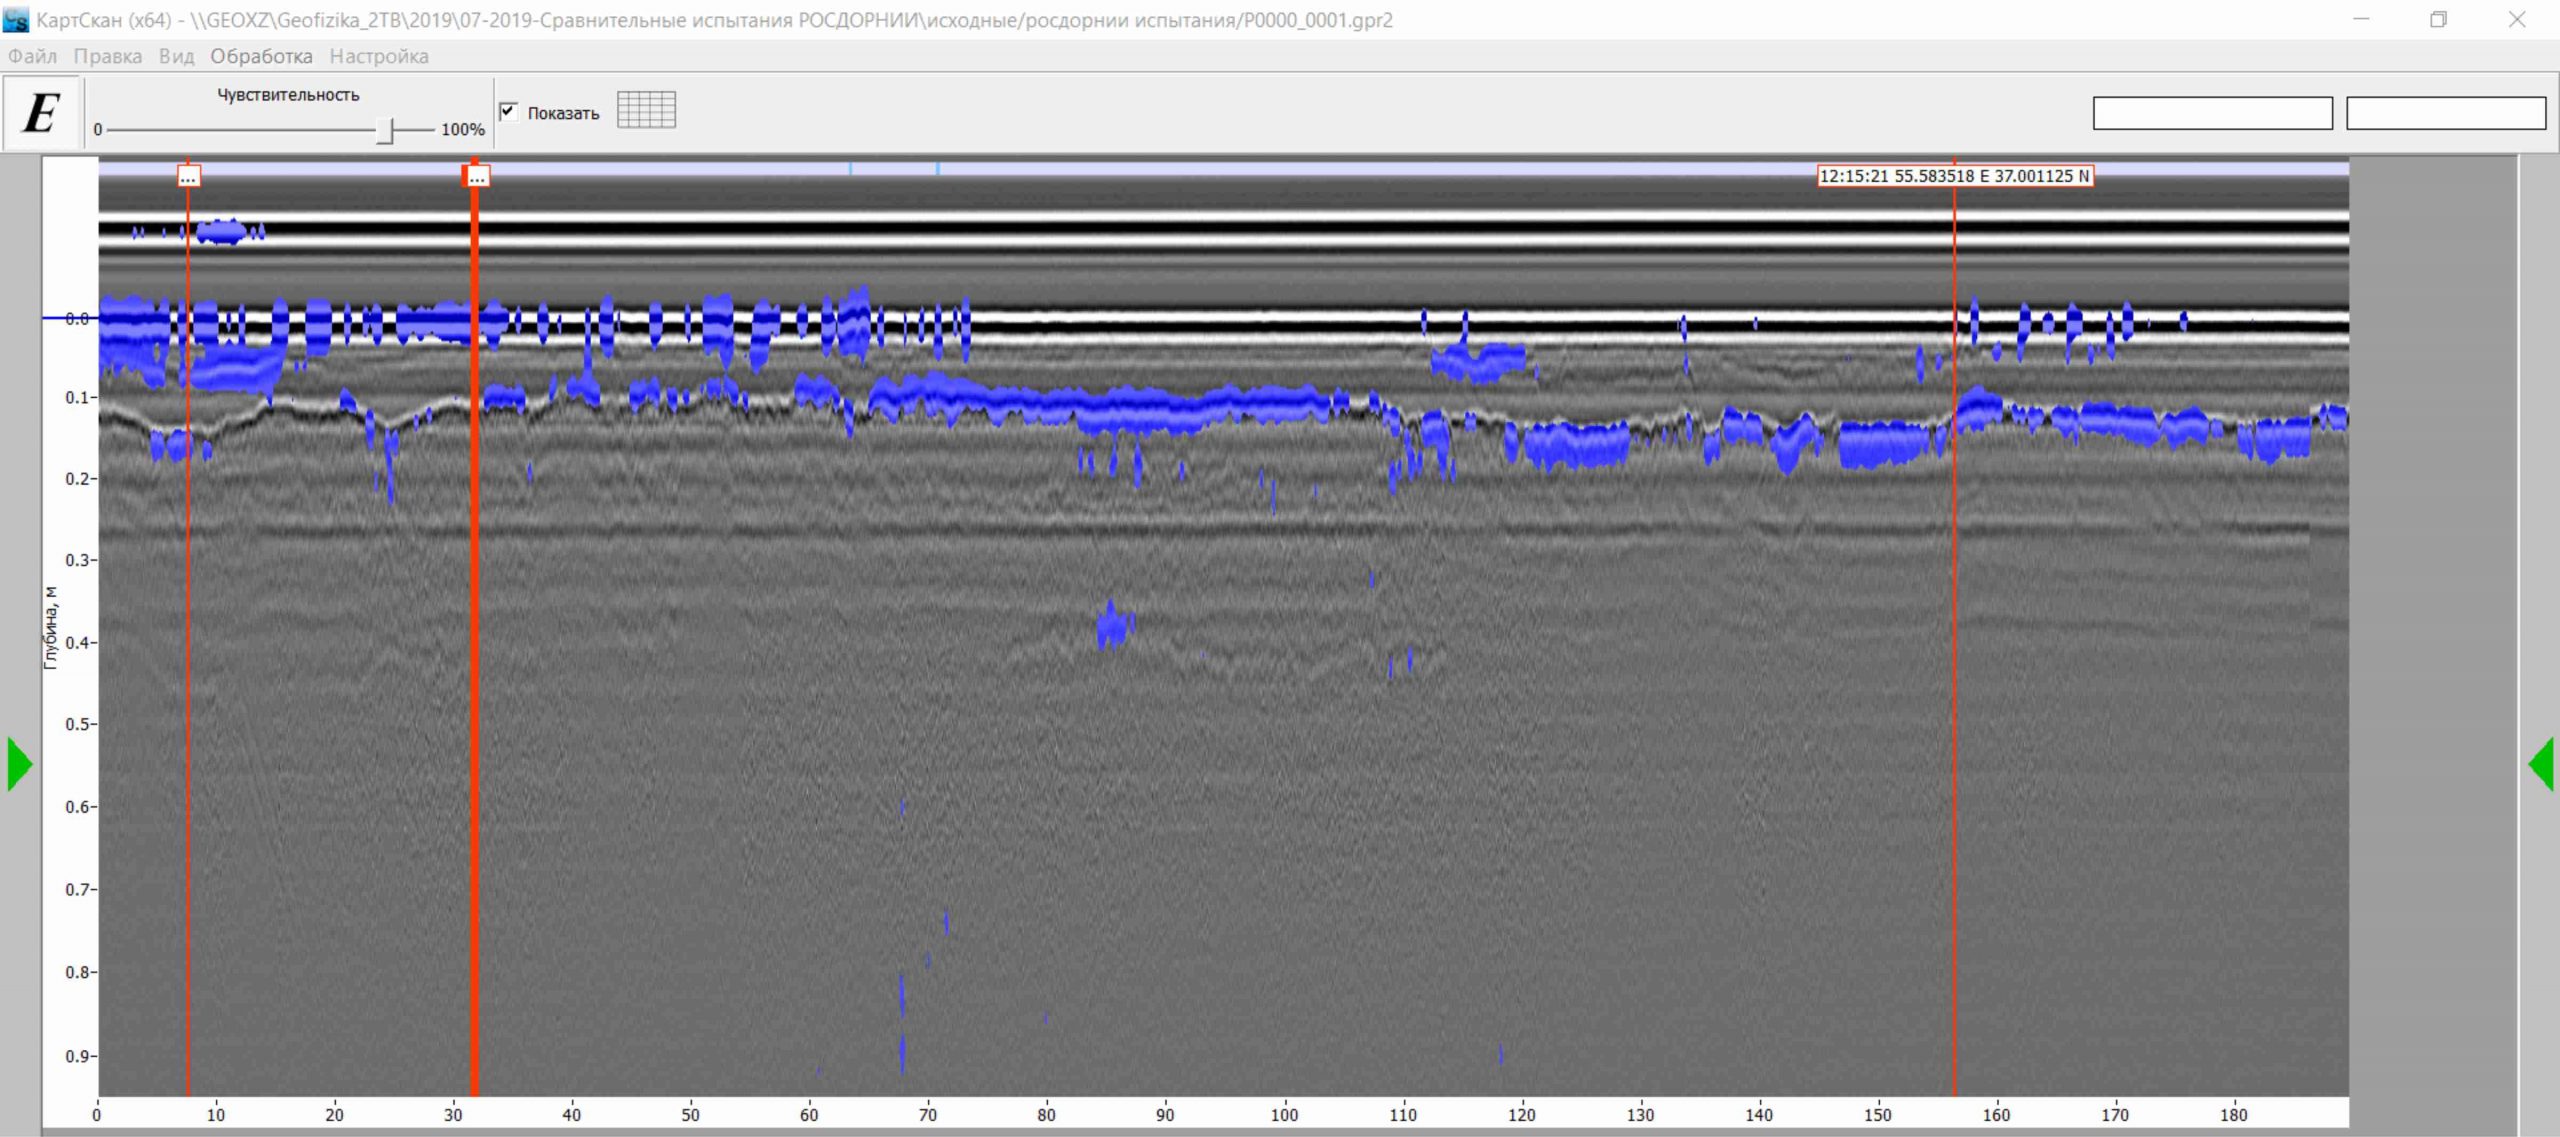
Changing the sensitivity with the appropriate slider allows changing the threshold for displaying the results. Increasing the sensitivity will display areas with a lower energy value and vice versa.
Selection of areas.
The area selection mode allows you to highlight some characteristic zone on the radargram with a coloured polygon.

