Georadiolocation survey of paved runways
Learn More →Abstract
The wear of airfields in Russia has a rather high index. At the same time, the passenger traffic increases annually and the load on the engineering structures of airports also increases. It is necessary to regularly monitor the state of airfield pavements using non-destructive methods. One such method is the ground penetrating radar (GPR). It has a high resolution and increased mobility of field work, which is especially important in the survey of airports with a high load, where the strip is accessible in strictly limited time intervals. This article presents the physical prerequisites for utilisation of the GPR and examples of GPR usage in examining the state and determining the structure of an airfield’s pavement.
The passenger traffic through airports increases annually and so does the load on the engineering structures of airports. Pavement wear becomes one of the natural stages of the airport’s lifecycle. This makes it necessary to perform scheduled monitoring of the condition of paved runways, taxiways, and adjacent engineering facilities.
With each passing year new developments in georadiolocation (ground penetrating radar or GPR) technologies allow for their active implementation into engineering surveys for design and construction of transport infrastructure. GPR is without doubt one of the most mobile and informative non-destructive methods of pavement monitoring. Constant development of instruments makes it possible to branch out new directions of georadiolocation surveys and solve more interesting and complex problems.
Physical prerequisites for utilisation of GPR
The theory behind the GPR method has in its basis a mechanism of reflection of electromagnetic waves from boundaries between layers with different electric properties (conductivity and permittivity) [1].
It is known that the maximum difference in permittivity is observed between air (ε=1) and water (ε=81). Their proportion defines the permittivity of a material from which a layer consists of. Dry monolithic and lightly cracked materials, which include asphalt and concrete, have relatively low permittivity values and high propagation speed of electromagnetic waves [2]. Water saturated materials have higher permittivity and, consequently, lower propagation speeds of EM waves. Penetration depth depends on EM wave attenuation and is directly linked to electrical resistivity.
In GPR surveys the main measured value is the arrival time of EM wave from a reflector to a receiver. By measuring the arrival times the reflecting object’s geometry can be determined. Amplitude-frequency characteristics allow for a qualitative determination of the surveyed medium’s properties.
The following are the prerequisites for utilising GPR in surveys of pavements: asphalt’s and concrete’s high electrical resistivity and, consequently, minimal EM wave attenuation, difference of dielectric properties between pavement layers; a substantial difference of properties is also observed on the boundary between pavement and its artificial subgrade. Damage to the pavement (cracks, caverns etc.) leads to further alterations of material’s properties, reflected on the GPR field data (radargrams).
Problems most frequently solved using GPR:
- determination of the pavement structure
- detection of defects within pavement
- detection of defects within subgrade
- detection of causes of pavement deformations on runways, taxiways, aprons and turn arounds
- control of pavement’s compliance with technical documentation
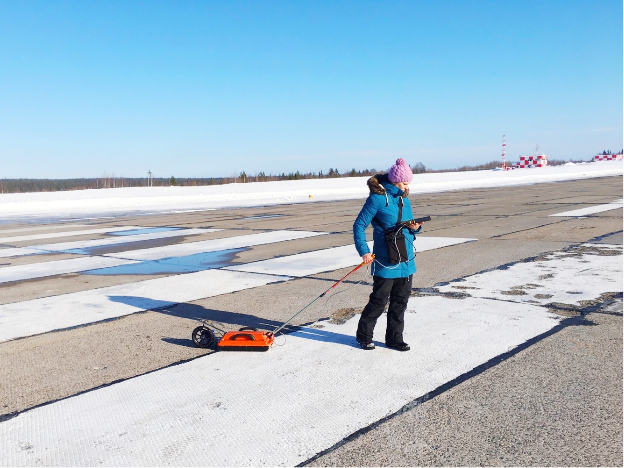
To solve these problems, we use “OKO-3M” GPRs (manufactured by “Logis” LLC, Russia) or their counterparts, equipped with antenna heads of various frequency. Antenna heads with frequency range of 700 to 2000 MHz are effective for pavement surveys as they provide penetration depth of up to 2 m with resolution of up to 0.02 m. Antenna heads with frequency range of 250 to 400 MHz are recommended for surveying of subgrade, as they provide penetration depth up to 5 m with resolution of up to 0.15 m.
Survey examples
Below are the specific examples of GPR surveys on airfields.
Figure 1 shows a radargram acquired during a survey on one of the airfields in Moscow, performed in order to determine the internal structure of the runway. Layer boundaries are marked on the GPR profile and are brought into correlation with core sampling data. Two layers of reinforcement were detected in the reinforced concrete layer at depths of 0.2 and 0.4 m. Layers of reinforced concrete, gravel, sand, and argillaceous subgrade were defined. This way the information about the runway’s structure was not limited to the core sampling point but was extended along the whole runway.
Figure 1. Radargram, acquired using the “OKO-3M” GPR with a 1700 MHz antenna, with interpretation results.
The problem of detection of defects within pavement is one of the most prominent in airfield surveys. Usually, such zones include areas with increased watering, raveling and softening of materials, areas with altered depth of construction elements or areas non-compliant with project documentation. Figure 2 shows a radargram of a runway with structural differences and defects. Besides the identification of pavement’s structure itself, areas of raveling and embedded cracks were located, and an area with a layer of cement concrete broken over time from use was also located. The destruction of the cement concrete was later confirmed by core sampling. This area had the most significant observed surface deformation.
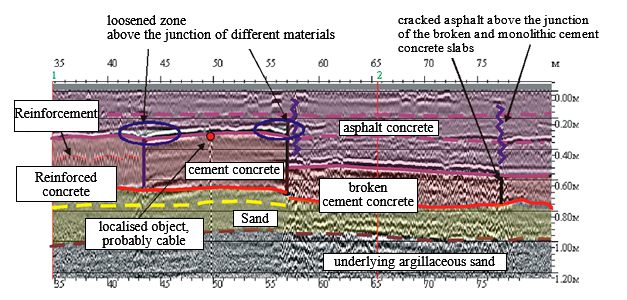
Figure 2. Radargram from a survey of an active airfield. “OKO-3M” GPR with a 1200 MHz antenna.
In surveys of engineering structures, including runway pavements, the prioritised objective is the identification of the reinforcement’s characteristics and detection of small voids and caverns. Figure 3 shows a radargram with identified caverns and location of reinforcement.
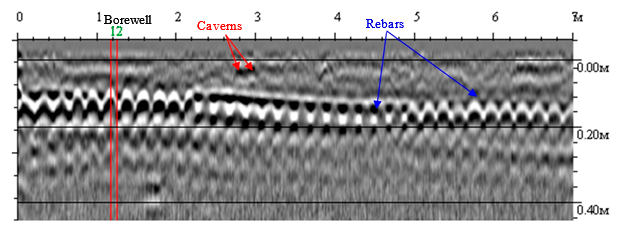
Figure 3. Radargram with identified caverns and location of reinforcement bars. “OKO-3M” GPR with a 1700 MHz antenna.
Determination of the reinforcement’s characteristics is an important aspect in evaluation of runway’s load capacity. Moreover, it is important to not only detect the presence or absence of reinforcement within a layer of reinforced or armoured concrete, but also to the depth, the number of layers and the step between rebars of reinforcement. Figure 4 shows a radargram with different types of reinforcement. On the left the reinforcement is located at a depth of 0.04 to 0.08 m, with rebar step of 0.15 m. On the right the reinforcement is levelled to 0.08 m but has a wider step of 0.3 m.
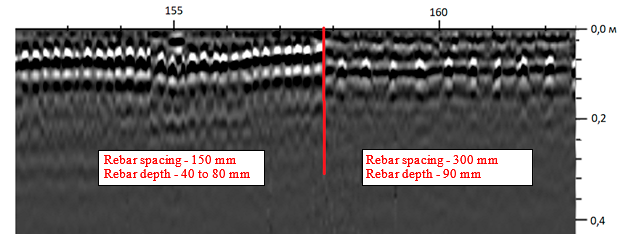
Figure 4. Radargram showing different reinforcement patterns within one area of a runway. “OKO-3M” GPR with a 1700 MHz antenna.
In problem areas it is necessary to perform a pseudo 3D survey using a system of parallel survey lines. Line spacing must be less than the size of target anomaly. Figure 5 shows a section from an areal survey performed along in-line survey lines with the depth of up to 0.16 m. Undeveloped or dry cracks are seen on the section as thin lines. When nearing the problem area, the lines thicken and turn into zones.
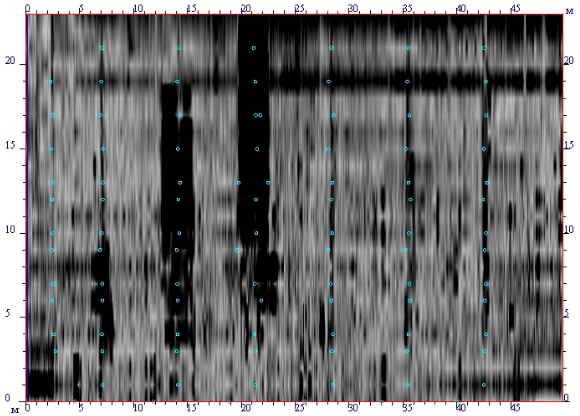

Figure 5. In-line section with the depth of up to 0.16 m. “OKO-3M” GPR with a 400 MHz antenna.
With depth the shape of an area with low frequency record and rereflections shifts. Further development is shown in Figure 6.
It is possible, that slab junctions in the problem area have wider gaps or miss water isolation. An elongated area of high amplitude signal is located near point 35.5. An area with low frequency record merges with another one positioned orthogonally at points 35.5 to 42.5.

Figure 6. In-line section with the depth of up to 0.6 m. “OKO-3M” GPR with a 1200 MHz antenna.
In the surveyed area between points 35.5 to 42.5 a slab without reinforcement was detected. It means that the slabs placed in that zone are unreinforced. A pipe of unknown purpose goes through whole area between points 39.5 to 39.7 at the depth of 2.0 – 2.3 m. The pipe is observed on all in-line survey lines.
The base of a sand layer is located at the depths of 0.8 to 0.85 m. Its minimal thickness is observed in the area of subsidence, which is attributed to the sand leaking to the surface or to the nearby communication lines.
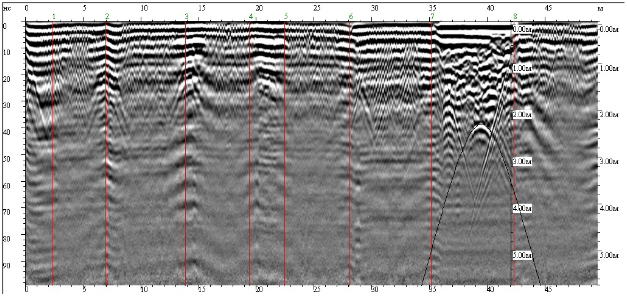
Figure 7. Radargram of in-line survey line №9. Unreinforced slab and reflections from the pipe at the depth of 2.15 m. “OKO-3M” GPR with a 400 MHz antenna.
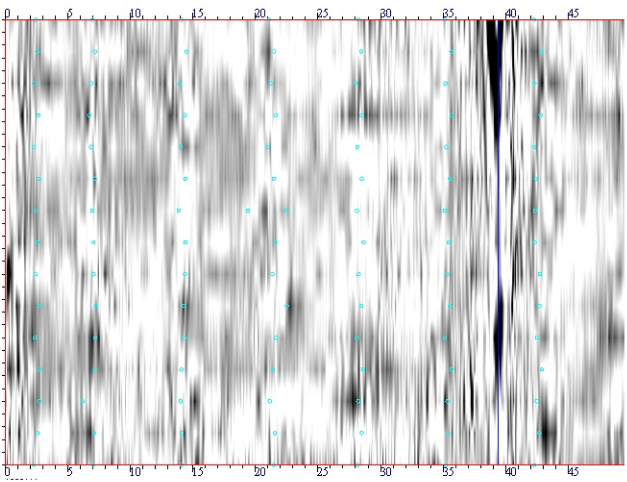
Figure 8. Section for the depth of 2.1 m. The axis of the pipe. “OKO-3M” GPR with a 400 MHz antenna.
Based on the results of the performed georadiolocation survey, zones with increased water content were located. These zones are associated with several junctions between reinforced concrete slabs and detected cracks. The pipe of unknown purpose was mapped going across the runway (points 35.5 to 42.5). An area of loosened ground is located along the pipe.
Thus, two versions of the origin of the subsidence were suggested:
- Antifreezing reagents infiltrate the sand layer from above the ground and saturate it making the sand more fluid. Then, under load, this water saturated sand is being pushed out to the surface through the open junctions. This version is supported by the presence of sand in the problem area. This also explains the start of the subsidence before the thawing season.
- The sand is carried over as a result of a leakage from the pipe or a suffusion along the pipe.
To confirm either version it would be necessary to rip-up the pavement.
Another example of georadiolocation being used for determination of depth of subsidence within the runway pavement is presented in Figure 9. This fragment of the survey is from the area of the runway with a collecting drain underneath it. The radargram shows signs of increased moisture of the whole structure. Also, a 0.7 m deep subsidence is clearly seen on the radargram. In order to level the subsidence, the runway was covered in several layers of asphalt, which are also clearly seen. Monitoring observations have shown that displaced zone is not stabilised, and the subsidence continues to develop.
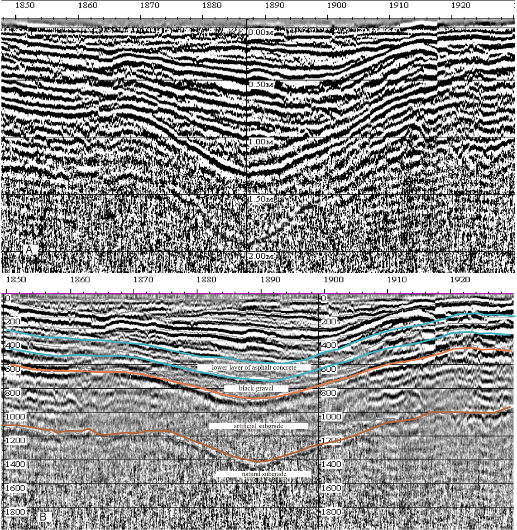
Figure 9. The subsidence within the pavement.
Possible complications in georadiolocation surveys of airfields.
At this moment the only limitation for the usage of GPR on pavements is the presence of reinforced slabs with frequent bar spacing within the pavement’s structure. The reason for such limitation is that frequently spaced bars act as a screen for the electromagnetic waves. In accordance with the theoretical basis of georadiolocation, in case of frequent reinforcement bar spacing it is possible to utilise only the antennas with wavelength lesser than the bar spacing [1].
The bar spacing often differs between in-line and crossline directions. The surveys can only be performed on survey lines aligned with the direction of frequent bar spacing.
Conclusions
Georadiolocation is an effective method for surveying of runway pavements. Being the most mobile out of all geophysical methods, GPR allows to quickly acquire information about the structure and general condition of runways, taxiways, and parking aprons, and to detect the defect zones. Received data is continuous along the runway, thus it allows surveyors to determine the best areas where to perform core sampling for detailed investigation of deformed areas. The mothod has a proven economic feasibility.
Reference list
- Vladov M.L., Starovoytov A.V., 2004. Introduction to georadiolocation. MSU publishing, Moscow. (Владов М. Л., Старовойтов А. В., 2004. Введение в георадиолокацию.
Изд-во МГУ, Москва.) - Starovoytov A.V., 2008. Interpretation of georadiolocation data. MSU publishing, Moscow. (Старовойтов А. В., 2008. Интерпретация георадиолокационных данных. Изд-во МГУ, Москва.)